
Unlock Success with Visual Project Management Tactics
Boost team productivity with visual project management—learn key techniques to visualize workflows and drive project success today!
New in Kanban Tasks: Gantt charts in Kanban Tasks.
The Power of Visual Project Management
Spreadsheets and dense text documents can make project progress feel like wading through mud. Visual project management offers a refreshing alternative, transforming abstract data into easily digestible visuals. This approach works because it aligns with how our brains naturally process information.
Think about it: a chart showing sales trends is far easier to understand than a long list of numbers. This visual approach fosters faster comprehension and improved team responses. It's not just a hunch either. The demand for visual project management tools is growing rapidly.
The global project management software market, which includes these visual tools, is expected to reach $7.24 billion by 2025. This growth reflects a need for solutions that enhance collaboration and resource allocation through visual aids like dashboards and Kanban boards. More detailed statistics are available here: Project Management Statistics. This trend highlights the global shift towards visual systems for better project tracking and communication.
Why Visuals Work
Visual project management offers several key advantages. First, it creates immediate clarity. Complex projects often have numerous interconnected tasks and dependencies. Visualizing these connections through tools like Gantt charts or network diagrams simplifies understanding, allowing teams to quickly grasp the big picture.
Additionally, visual cues enhance team alignment. When everyone sees the project's status, dependencies, and progress in a shared visual format, it minimizes misunderstandings and ensures everyone is on the same page. This shared understanding is crucial for project success.
Visuals also speed up decision-making. By highlighting bottlenecks and critical paths, visual project management empowers teams to quickly identify and address potential issues. This leads to faster, more informed decisions. For a deeper dive into project management for engineers, check out this resource: project management for engineers. You might also find this interesting: Why Visual Task Management Works. Improved communication and collaboration translate into more efficient project execution and a higher likelihood of success.
Visual Tools That Actually Transform Workflows
Visual project management is more than just a popular concept; it's a practical approach with a real impact on project success. But with so many options available, which visual tools truly deliver? This section explores the essential visual tools changing how teams work, offering real-world examples and practical implementation advice.
Kanban Boards: Visualizing Workflow For Maximum Efficiency
Kanban boards are a cornerstone of visual project management. These boards, typically divided into columns representing project stages (e.g., To Do, In Progress, Done), give teams a clear visual overview of their workflow. Each task is represented by a card that moves across the board as work progresses, making it easy to track project status and identify bottlenecks.
Imagine a marketing team tracking content creation, from ideation to publication, on a Kanban board. This visual representation allows them to quickly spot stalled tasks and address roadblocks, improving both efficiency and communication.
Gantt Charts: Mastering Timelines and Dependencies
While Kanban boards focus on workflow, Gantt charts emphasize timelines and dependencies. These charts represent tasks as horizontal bars on a timeline, clearly showing the start and end dates of each task and how they relate to one another. This is especially helpful for complex projects with many interconnected tasks.
For example, a software development team can use a Gantt chart to visualize the dependencies between different coding modules. This ensures tasks are completed in the correct order and the project stays on schedule. Gantt charts empower teams to proactively manage deadlines and avoid timeline issues by providing a clear project timeline overview.
Visual Dashboards: Keeping Everyone Aligned and Informed
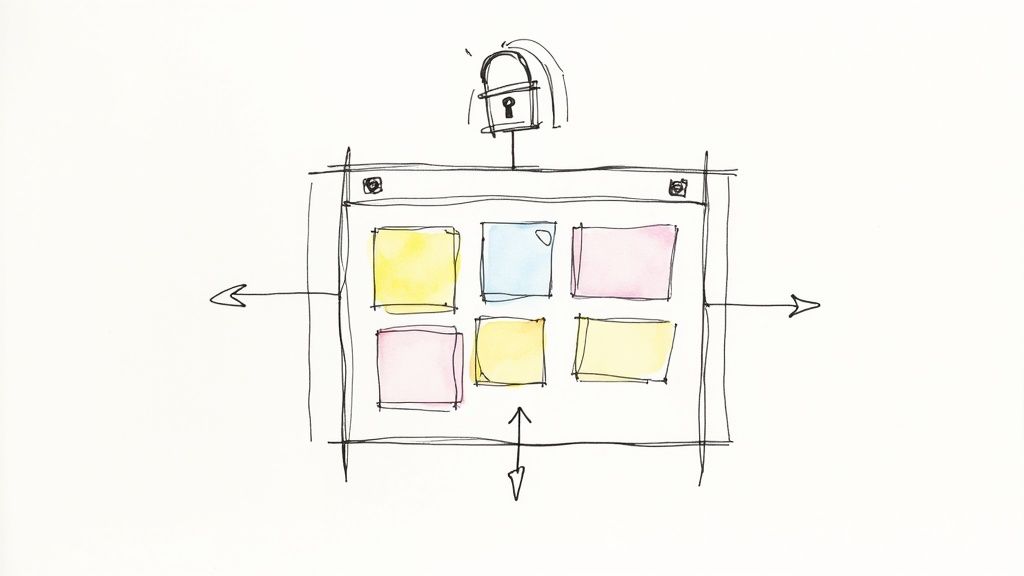
Visual dashboards act as a central hub for all essential project information. They offer a real-time overview of key metrics, progress indicators, and potential risks. These dashboards can be tailored to show the most relevant data for various stakeholders, ensuring everyone stays informed without constant meetings.
A construction project manager, for instance, might use a visual dashboard to track budget expenditure against planned costs, progress against the schedule, and potential weather delays. This single source of truth helps teams make data-driven decisions in real time.
Choosing The Right Visual Tool For Your Project
The best visual tool depends on the specific project needs. Kanban boards are excellent for managing workflow and identifying bottlenecks, while Gantt charts are perfect for visualizing timelines and dependencies. Visual dashboards provide a comprehensive overview of project status and key metrics. Using these tools together can create a robust visual management system that increases transparency and boosts productivity.
To help you choose the right platform, let's take a closer look at some popular options:
To help you choose the right platform, the following table offers a comparison of leading visual project management platforms:
Visual Project Management Platforms: What Actually Works
A comparative analysis of leading visual project management platforms highlighting their key features, strengths, and ideal use cases
| Platform | Market Share | Visual Features | Best For | Pricing Model |
|---|---|---|---|---|
| Monday.com | Significant | Kanban, Gantt, dashboards, timelines | Collaborative teams, marketing, sales | Subscription-based |
| Asana | High | Kanban, Gantt, list views, calendar views | Project management, task management, team collaboration | Freemium and subscription |
| Trello | High | Kanban, list views, calendar views | Simple project management, task tracking, personal organization | Freemium and subscription |
| Jira | High | Kanban, Scrum boards, roadmaps | Software development, agile project management | Subscription-based |
| Microsoft Project | Significant | Gantt, timelines, resource management | Complex projects, enterprise project management | Subscription-based |
The table above showcases a variety of platforms, each with its own strengths in visual project management. Consider your team's specific needs and project complexity when selecting the best fit.
The increasing use of visual project management tools demonstrates their impact on project success. Although only 23% of organizations currently use project management software, 77% of high-performing projects utilize these tools. Companies that invest in structured project management, including visual approaches, reduce waste by 28 times compared to those that don't. Find more detailed statistics here. This underscores that visual tools aren't just about aesthetics; they're about achieving tangible results.
Measurable Benefits of Going Visual
Visual project management isn't just a popular approach; it delivers real results. This section explores the quantifiable improvements teams experience when they move away from spreadsheets and embrace visual tools. We'll examine how visualization improves communication, speeds up decision-making, and accelerates team onboarding.
Enhanced Communication and Reduced Misunderstandings
Visualizing work fosters a shared understanding, significantly reducing miscommunication. A simple Kanban board, for example, displays project status and individual responsibilities for all team members to view. This transparency eliminates ambiguity and ensures everyone is on the same page.
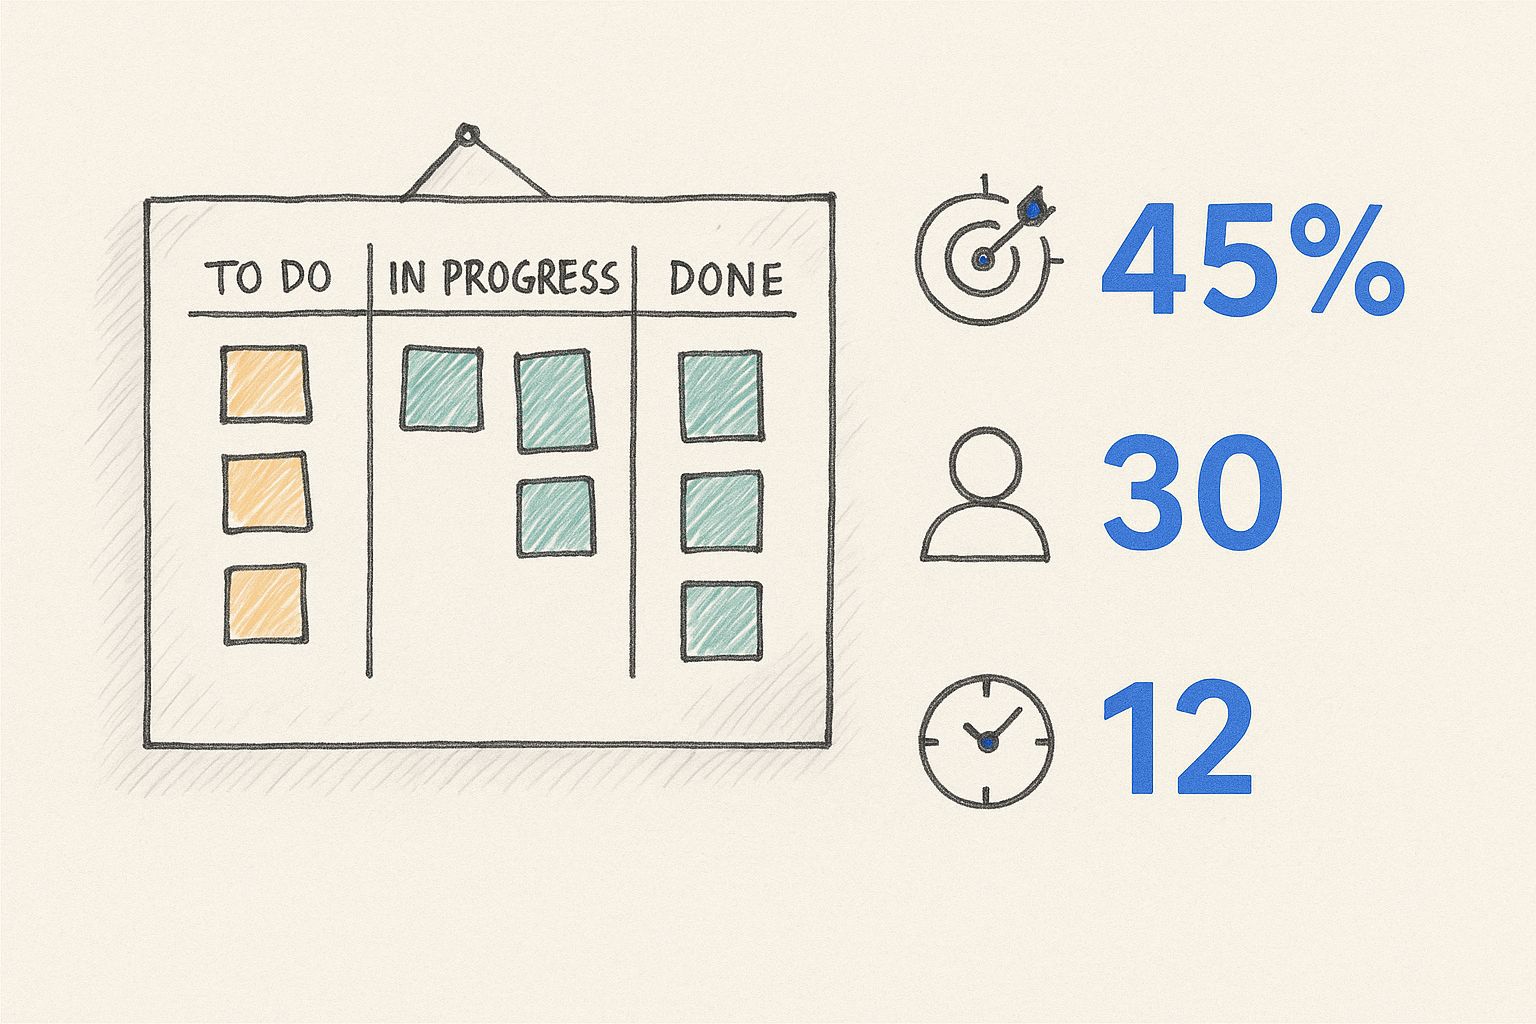
The infographic above depicts a basic Kanban board, showing the flow of tasks from "To Do" to "In Progress," and finally to "Done." This visual workflow representation helps teams quickly grasp task status and pinpoint bottlenecks, resulting in more efficient project execution. For a deeper dive into this topic, check out our guide on Kanban for Non-Technical Teams: Simplifying Project Tracking.
Faster Decision-Making and Problem Solving
Visual project management makes bottlenecks and roadblocks readily apparent. Picture a Gantt chart clearly highlighting a delayed task impacting the entire project timeline. This immediate visibility allows teams to react swiftly, make well-informed decisions, and address issues before they escalate.
Streamlined Onboarding and Improved Team Integration
New team members often face challenges understanding complex project structures and team dynamics. Visual systems simplify onboarding by providing a clear overview of workflows, roles, and responsibilities. Some organizations report that new team members onboard 60% faster with visual project management systems. Remote team management software can be a valuable tool for effective implementation, particularly for distributed teams.
Measuring the ROI of Visual Management
While the advantages of visual project management are evident, quantifying its return on investment (ROI) is crucial. Below is a table summarizing some key metrics and the improvements seen when transitioning to visual project management.
Let's take a look at the numbers that truly highlight the impact of visual project management. The table below, "Visual Project Management: The Numbers That Matter," presents statistical data showcasing the measurable improvements experienced by organizations after adopting these practices.
| Performance Metric | Traditional PM (Average) | Visual PM (Average) | Improvement Percentage |
|---|---|---|---|
| Project Completion Rate | 70% | 85% | 21% |
| On-Time Project Completion | 55% | 75% | 36% |
| Cycle Time (Days) | 15 | 10 | 33% |
| Team Velocity (Points/Sprint) | 25 | 35 | 40% |
| Stakeholder Satisfaction | 3.5/5 | 4.2/5 | 20% |
As this data illustrates, adopting visual project management leads to significant improvements across various key performance indicators. From increased project completion rates to enhanced stakeholder satisfaction, the benefits are tangible and substantial.
Key metrics for measuring success include:
- Project Completion Rate: Track the percentage of projects completed on time and within budget after implementing visual tools.
- Cycle Time: Measure the time it takes to complete tasks or projects, comparing pre- and post-implementation data.
- Team Velocity: Assess the amount of work a team can complete within a given sprint or timeframe, noting any improvements.
- Stakeholder Satisfaction: Gauge stakeholder feedback on project visibility, communication, and overall project success.
By tracking these metrics, organizations can showcase the tangible value of adopting a visual approach and justify continued investment in visual management tools. These benefits span various industries, transforming how teams manage projects in software development, construction, marketing, and more.
Implementing Visual Systems Without Chaos
Switching to visual project management doesn't have to be a headache. This section offers a practical guide for any organization, no matter where they are in their project management journey. We'll look at proven strategies from teams who have successfully adopted visual systems, covering workflow analysis, tool selection, and template design.
Assessing Your Current Workflow
Before jumping into new tools, it's essential to understand your existing processes. This assessment helps identify where visual project management can be most beneficial. Start by documenting your current workflow:
- List all the steps in a typical project.
- Identify key stakeholders and their roles.
- Pinpoint pain points and inefficiencies.
For example, if communication breakdowns are a common problem, visual tools like Kanban boards can bring immediate improvements.
Selecting the Right Tools
Once you have a clear picture of your current workflow, you can choose the right visual tools to meet your specific needs. Consider factors like project complexity, team size, and budget. Some popular tools include:
- Kanban boards: These are great for managing workflow and visualizing task progress, allowing teams to quickly identify bottlenecks.
- Gantt charts: These are effective for visualizing project timelines and dependencies, which helps with scheduling and resource allocation.
- Visual dashboards: These excel at providing a comprehensive overview of project status and key metrics. This gives everyone access to up-to-date information and improves decision-making.
Consider tools that integrate with your existing software, like Google Workspace, for a smooth transition. Tooling Studio's Kanban Tasks extension offers a native Kanban board within Gmail and Google Tasks, simplifying project management within the familiar Google environment.
Creating Standardized Visual Templates
Consistency is essential for effective visual project management. Creating standardized templates ensures that all projects use the same visual language. This streamlines onboarding and reduces the learning curve for new team members. Templates can include:
- Project timelines
- Status reports
- Meeting agendas
Templates provide structure and help maintain a consistent visual style across projects.
Phased Implementation and Team Training
Introducing visual systems gradually minimizes disruption and lets teams adapt at their own pace. Start with a pilot project to test the chosen tools and templates. Gradually roll out the system to other teams, providing training and support throughout the process.
Building team visual literacy doesn't require extensive training. Start with the basics and gradually introduce more advanced techniques. This incremental approach helps teams develop their skills organically.
Establishing Practical Governance
Visual systems need governance to stay organized and useful. Establish clear guidelines for:
- Updating visual tools
- Managing access permissions
- Archiving completed projects
These guidelines prevent visual overload and ensure the system remains a valuable resource. The future of visual project management software is bright, with the market projected to reach around $20.5 billion by 2030, growing at a CAGR of 15.7%. This growth is fueled by the demand for real-time visual monitoring of projects. You can find more detailed statistics here. As businesses strive for efficient project delivery, visual project management platforms become essential. This trend highlights the growing importance of integrating effective visual systems into project management strategies.
Overcoming Visual Management Roadblocks

While visual project management offers many advantages, it also presents unique challenges. This section explores common roadblocks teams face when implementing visual systems and offers practical solutions to navigate them successfully.
Visual Overload: Too Much of a Good Thing
One common issue is visual overload. Having too many charts, graphs, and visual elements can create confusion rather than clarity. Imagine trying to navigate a city with a map that displays every single street, alley, and building – it becomes overwhelming.
To combat this, prioritize simplifying your visualizations. Use clear labels and consistent color coding, and only include the most essential information. Think of a well-designed subway map; it shows key routes and stations, making navigation straightforward.
Inconsistent Updating: The Trust Breaker
Another hurdle is maintaining consistency in updating visual tools. An outdated Kanban board or Gantt chart loses its value and erodes trust in the system. It's like using a GPS with outdated maps - you'll likely end up lost.
The solution is to establish clear update protocols. Assign responsibility for updating specific visuals and create a regular update schedule. This ensures the information remains current and reliable.
Resistance to Change: Winning Over Text-Oriented Team Members
Some team members may resist transitioning to visual methods, particularly those comfortable with traditional text-based approaches. This resistance is normal and can be addressed through thoughtful change management.
Begin by clearly explaining the benefits of visual project management. Provide comprehensive training on how to use the new tools and showcase success stories from other teams.
Integration Challenges: Connecting Visuals to Existing Workflows
Integrating new visual tools with existing workflows can be a challenge. Selecting tools that integrate seamlessly with your current software, like Google Workspace, minimizes disruption. You might be interested in: How to master Google Workspace Project Management.
Strive for a smooth transition by choosing platforms that complement your existing tools and processes. For example, Tooling Studio’s Kanban Tasks extension offers a Kanban board within Gmail and Google Tasks, streamlining project management within the familiar Google environment.
Building Visual Thinking Skills: Seeing the Bigger Picture
Developing visual thinking skills within the team is crucial for maximizing the effectiveness of visual project management. This involves training team members to effectively interpret and analyze visual information.
Start with basic training and gradually introduce more complex visual concepts. This empowers teams to fully utilize the power of visual tools and make more informed decisions.
By proactively addressing these potential roadblocks, teams can ensure a seamless transition to visual project management and unlock its full potential. This approach promotes greater team alignment, improved communication, and ultimately, more successful projects.
The Future of Visual Project Management
Visual project management is constantly evolving, adapting to new technologies and changing team dynamics. This section explores some key trends shaping how we'll visualize and manage projects in the coming years.
The Rise of AI in Visual Project Management
Artificial Intelligence (AI) is rapidly transforming numerous fields, and project management is no exception. AI is enhancing visual tools with features like automated updates and predictive visualizations. Imagine a Gantt chart that automatically adjusts timelines based on real-time progress and potential roadblocks. This eliminates manual updates and provides more accurate project forecasting.
AI can also analyze project data to identify potential risks and suggest mitigation strategies. This proactive approach empowers project managers to address potential problems before they impact the timeline or budget.
Immersive Technologies: VR and AR for Project Visualization
Virtual Reality (VR) and Augmented Reality (AR) offer exciting new possibilities for visualizing complex project scenarios. Imagine stepping into a VR environment to walk through a building design before construction even begins, or using AR to overlay project plans onto a physical space.
These immersive technologies create innovative ways to understand and interact with project data, ultimately fostering better collaboration and more informed decision-making.
Integration with Collaboration Platforms
Integrating visual project management tools with collaboration platforms is another key trend. This integration creates a central hub for all project-related communication, files, and progress updates.
Imagine a Kanban board integrated with your team's chat platform, enabling seamless communication and real-time updates. This streamlined approach simplifies workflows and keeps the entire team aligned.
Preparing for the Future of Visual Project Management
These advancements call for teams to adapt and acquire new skills. Visual literacy, the ability to interpret and analyze visual data, will become increasingly important. Teams will also need to embrace data-driven decision-making, using AI-powered insights to optimize project performance.
By staying informed about these trends and investing in the right tools and training, organizations can prepare for success in the ever-evolving world of visual project management.
Want to experience the power of visual project management within your Google Workspace? Tooling Studio offers Kanban Tasks, a Chrome extension that integrates a Kanban board directly into Gmail and Google Tasks. Start visualizing your workflow and boosting your team's productivity today!
 Download our Plugin