
Sales Process Flowchart: Streamline Your Pipeline
Build a sales process flowchart that clarifies pipeline stages, improves handoffs, and helps reps follow a repeatable process.
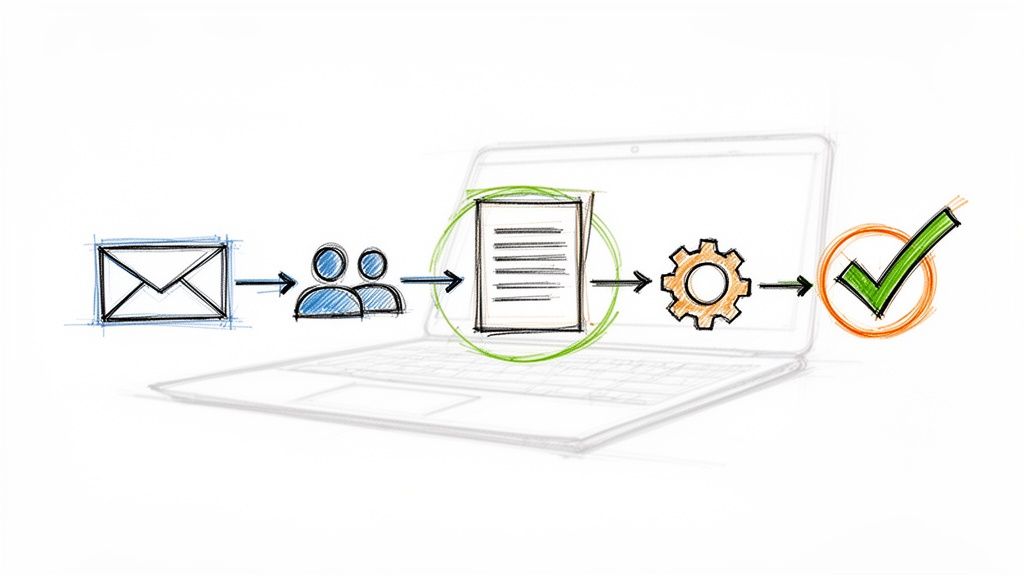
Think of a sales process flowchart as the GPS for your sales team. It’s a visual map that lays out every single step a potential customer takes, from that first "hello" all the way to a signed contract. It turns messy, unpredictable sales activities into a clear, repeatable system that everyone can follow.
This kind of visual guide is a game-changer for bringing new reps up to speed, spotting where deals get stuck, and making sure every prospect gets the same great experience.
Why a Sales Process Flowchart Is Your Secret Weapon
Is your team's sales process currently buried in chaotic email threads and a patchwork of to-do lists? I've seen it a hundred times. A well-designed sales process flowchart is what bridges that gap between disorganized communication and a predictable revenue engine, especially for teams already living in Google Workspace. It brings some much-needed structure to what often feels like a free-for-all.
Instead of guessing what to do next, every person on the team knows their exact role and the specific actions needed to nudge a deal forward. This visual map standardizes the entire customer journey, so everyone is following the same proven plays.
Turning Chaos into Clarity
When there's no defined process, every salesperson invents their own way of doing things. That leads to wildly inconsistent results and a pipeline that’s a nightmare to manage. A flowchart cuts through the noise by creating a single source of truth.
This clarity is absolutely critical for forecasting. When every stage is clearly defined and followed, you can track conversion rates accurately and start predicting future revenue with real confidence. In fact, after putting a structured process in place, 51% of sales teams reported massive improvements in their forecast accuracy. You can dig into more data on how structured processes impact sales performance if you're curious.
Standardizing for Success
A visual sales process is a must-have for any growing team. New hires can get their bearings almost immediately by following the flowchart, which dramatically cuts down the time it takes for them to become productive. This standardization also makes sure your best practices are actually practiced by everyone, not just your seasoned top performers.
A few key wins from a standardized process include:
- Faster Onboarding: New reps have a clear playbook to follow from day one.
- Consistent Customer Experience: Every prospect gets the same high-quality treatment.
- Easier Performance Management: It becomes much easier for managers to see where reps are struggling and offer targeted coaching.
A flowchart isn't just a diagram; it's a strategic agreement on how your team wins deals. It aligns everyone on the most effective path to closing, eliminating guesswork and wasted effort.
This structured approach is really catching on. Recent data shows that a huge 66% of US sales leaders are now tailoring their processes specifically for B2B environments. They've recognized that a visualized workflow is the key to wrangling complex, multi-touch sales cycles.
At the end of the day, a sales process flowchart empowers your team to work smarter, not harder. It gives you the framework you need to optimize your workflow, pinpoint areas for improvement, and build a scalable system that drives consistent growth—all within the familiar tools of Google Workspace.
Mapping Your Core Sales Stages From Lead to Close
The bedrock of any good sales process flowchart is a crystal-clear map of your core sales stages. This isn’t about grabbing a generic template and calling it a day. It's about charting the actual journey your customers take, from the moment they first hear about you to the day they become a happy, paying client.
Nailing this down gets your entire team on the same page, speaking the same language. More importantly, it gives everyone an instant, at-a-glance understanding of your pipeline's health. Think of it like building a highway—each stage is an exit ramp, and you need to define the exact criteria a deal must meet to take that exit and move on. Without those clear markers, your pipeline turns into a traffic jam of stalled deals and confused reps.
From Unqualified Lead to Solid Prospect
The journey always starts the second a potential customer enters your orbit. These early stages are all about filtering—separating the genuine fits from the tire-kickers. If you rush this part, you'll pay for it later with hours wasted chasing down leads who were never going to buy anyway.
Let's use a B2B SaaS startup as an example. Their very first stage might just be "New Lead Inbound." This is simply the catch-all for anyone who fills out a form, signs up for a webinar, or sends a direct email. The next move is what really matters.
- Lead Qualification: Now, a sales development rep (SDR) does some digging. Does this person fit our ideal customer profile? Is their company the right size, in the right industry? This isn't a deep interrogation; it's a quick sniff test to see if a real conversation is even worthwhile.
- Needs Assessment: Once a lead is qualified, they graduate to "prospect." An account executive (AE) takes over for a discovery call. The whole point here is to uncover their specific pain points and figure out if your product can actually solve a real business problem for them.
This is all about moving from chaos to clarity. You’re taking a jumbled mess of inbound interest and turning it into a predictable, scalable system for growth.
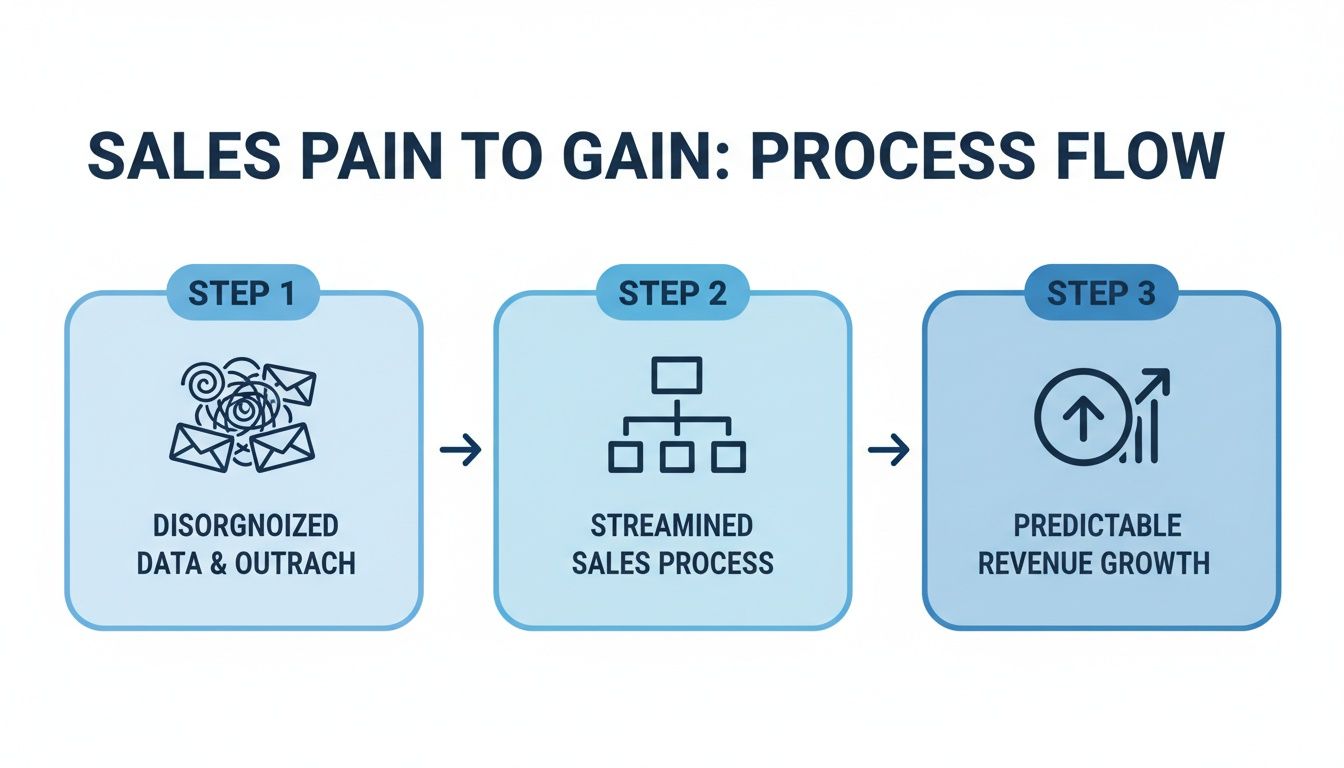
A simple flowchart transforms a disorganized process into a structured path that leads to predictable growth.
Navigating the Mid-Funnel Journey
So, you've confirmed the prospect has a real need. Great. The middle of your flowchart is all about showing them the value you bring and building the business case. This is where deals often get stuck in the mud, so having well-defined steps is absolutely critical for keeping things moving.
Back to our B2B SaaS company, their mid-funnel could look something like this:
- Product Demo: The AE walks them through a customized demo, zeroing in on the features that directly address the pain points uncovered during discovery.
- Proposal Sent: After a successful demo, a formal proposal is drawn up. This document clearly lays out the scope, pricing, and all the terms.
- Negotiation: This is the stage for ironing out the final details. It’s for handling objections, answering last-minute questions, and getting the final terms locked in with the decision-makers.
The most effective sales process flowcharts are built collaboratively. Involve your sales reps in defining these stages. They are on the front lines and know the real-world steps, potential roadblocks, and buying signals better than anyone.
Crossing the Finish Line
The final stretch is all about locking in the commitment and making sure the transition from prospect to customer is seamless. A deal isn't "won" until the ink is dry and the new customer is on the path to success. Defining these last steps prevents deals from falling apart at the eleventh hour. If you're looking for ideas, check out the detailed sales pipeline examples in our guide to see how other businesses structure these closing phases.
For our SaaS company, the final stages in their flowchart would be:
- Verbal Commitment: The prospect has given the green light and intends to sign.
- Contract Sent: The official agreement is in their hands, ready for a signature.
- Closed-Won: The contract is signed, sealed, and delivered. The deal is officially done.
- Onboarding: The new customer is warmly handed off to the customer success team to kick off implementation.
Each of these stages is a crucial milestone. By mapping them out visually in a flowchart, you're not just drawing shapes and arrows—you're creating a powerful, repeatable framework for success.
Bringing Your Flowchart to Life in Google Workspace
Okay, so you've mapped out your sales stages. That's a huge step. But a flowchart is just a pretty diagram until your team is actually using it. Let's be honest, a sales process is only useful if your team can live and breathe it every single day.
The good news? You don’t need to go out and buy another complicated piece of software. You can build a surprisingly powerful, interactive system right inside the Google Workspace tools you already have. The goal is to make your existing stack work harder for you, turning that chaotic inbox into a clean, organized command center for your entire sales pipeline.
Let's walk through how to actually make this happen.
Start with a Simple Visual in Google Drawings
Before you get into the weeds with data and integrations, create a clean, shareable version of your flowchart. Google Drawings is perfect for this—it’s a no-fuss tool that gets the job done. Just lay out your stages, decision points, and the flow of actions using simple shapes and arrows.
This visual becomes your team's official playbook. It’s the single source of truth everyone can refer back to, making sure you’re all on the same page. Think of it as the architectural blueprint you'd have before starting to build a house.
From Diagram to Data with Google Sheets
A drawing is great for reference, but you need data to actually manage your pipeline. This is where Google Sheets comes in. You can spin up a simple but effective sales pipeline tracker that mirrors the stages you just defined in your flowchart.
Set up a sheet with columns for all the key info. This simple structure lets you track every deal and see your entire pipeline at a glance. I'd recommend starting with these:
- Deal Name: The company or opportunity.
- Primary Contact: Your main point of contact.
- Deal Value: The potential revenue from the sale.
- Current Stage: Use a dropdown menu with your defined stages (e.g., Qualified, Demo, Proposal Sent).
- Next Action: What’s the very next step to move this deal forward?
- Last Contact Date: This is critical for making sure nothing falls through the cracks.
This spreadsheet is the data backbone of your flowchart. It turns those abstract stages into tangible, trackable deals you can actually quantify.
The real magic happens when your visual flowchart directly influences your daily workflow. The best systems don't require you to constantly switch between a diagram and your email; they merge the two into one seamless experience.
Turn Your Gmail into a Kanban Board
This is where it all comes together. A spreadsheet is great for tracking, but let's face it—the real work happens in your inbox. By using a lightweight tool like Kanban Tasks, you can build a visual Kanban board directly inside Gmail. Each column on this board will represent a stage from your sales flowchart.
Suddenly, you can manage your deals visually, right where you do most of your work. Instead of just updating a spreadsheet, you can literally drag and drop an email that represents a deal from one stage to the next.
For example, after a killer product demo, you just drag that client’s email from the "Demo" column over to "Proposal Sent." That simple action feels great, gives you a real sense of progress, and keeps your pipeline beautifully organized. If you're looking for more ways to tighten up your sales workflow, you might get some ideas from our guide on optimizing your sales process.
Here’s a rough idea of how a shared Kanban board in Gmail can visually represent your sales stages.
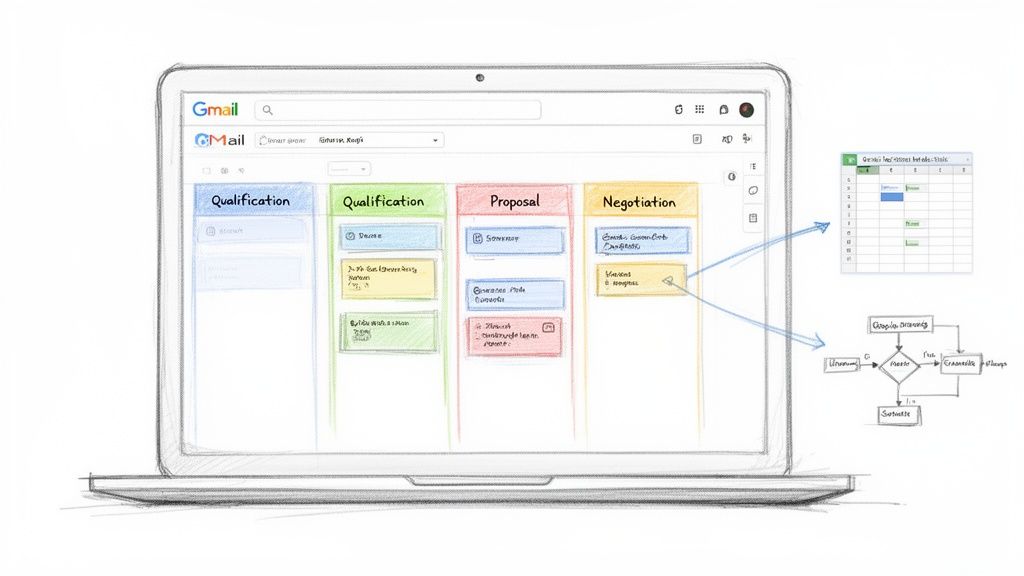
This setup transforms your inbox into a living, breathing version of your flowchart. Each column is a sales stage, and each email is a deal moving through the pipeline.
By stringing these Google Workspace tools together, you create a seamless connection between your documented process (the flowchart), your data (the spreadsheet), and your day-to-day work (the Kanban board in Gmail). That’s how you get your team to actually adopt the process and turn that well-designed flowchart into a real, revenue-generating engine.
Defining the Rules and Triggers for Each Stage
A sales process flowchart is more than just a pretty diagram. Its real power comes alive when you define the specific rules and triggers that dictate how a deal moves from one stage to the next.
Think of these as the traffic lights for your sales pipeline. They ensure deals only move forward when they’re genuinely ready, which is crucial for preventing pipeline bloat and keeping your forecasts honest. Without clear rules, your flowchart is just a suggestion. With them, it becomes an intelligent, reliable system. This means setting up non-negotiable criteria—or "stage-gates"—that have to be met before anyone can advance an opportunity.
Establishing Your Stage-Gate Criteria
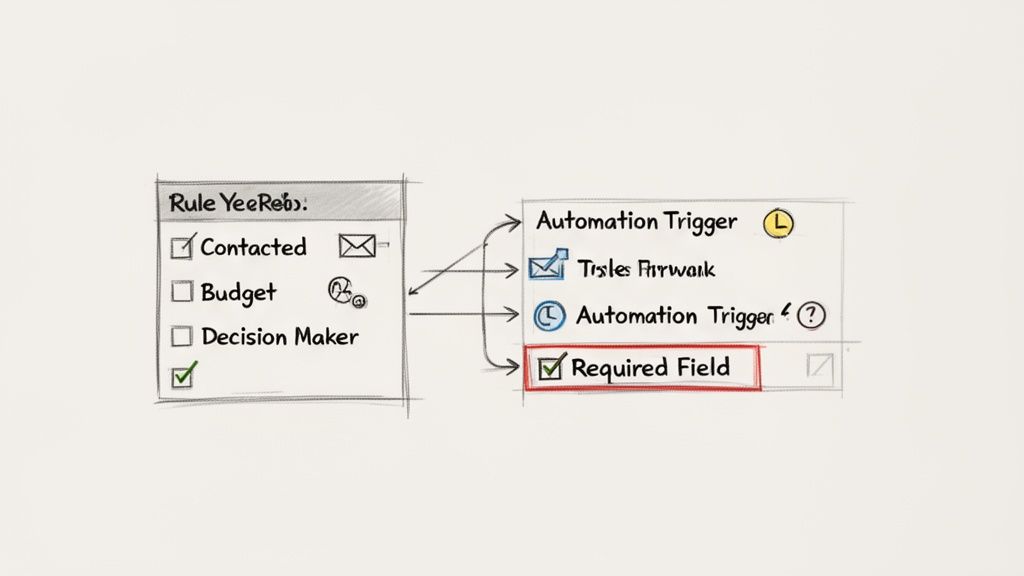
Stage-gate criteria are simply the specific actions or pieces of information required to complete a stage. This one practice brings much-needed discipline and consistency to your entire sales motion, ensuring every rep qualifies and moves leads with the same level of rigor.
For instance, a deal can't jump from "Needs Assessment" to "Product Demo" until certain boxes are checked. This stops reps from giving demos to unqualified prospects, which saves everyone a ton of time.
Here’s what this looks like in the real world:
- To move from "Lead" to "Qualified": The prospect has to meet three out of four BANT criteria (Budget, Authority, Need, Timeline), which must be confirmed during the discovery call.
- To advance from "Qualified" to "Demo": The rep must have identified the main decision-maker and gotten their confirmation to attend the demo.
- To go from "Demo" to "Proposal Sent": The prospect must have verbally agreed that the solution solves their core problems and asked for pricing details.
A quick tip: don't create these rules in a vacuum. Your best stage-gate criteria will come from your top-performing reps. They have an intuitive feel for the signals of a healthy, progressing deal—so ask them what they look for.
Automating Triggers in Google Workspace
Once your rules are set in stone, the next move is to automate the actions—or "triggers"—that fire off when a deal enters a new stage. This is where you can slash manual admin work and make sure important follow-ups never fall through the cracks. Luckily, Google Workspace offers some simple but powerful ways to build these triggers.
You can set up automated actions that make the whole process smoother. For a deeper dive into this, check out our comprehensive guide on workflow automation for small business.
Here are a few simple automations you can build right now:
- Gmail Filters for New Leads: Set up a filter that automatically slaps a "New Lead" label on any email coming from your website's contact form. This is an instant way to flag new opportunities right in your inbox.
- Google Tasks for Follow-Ups: When a deal is moved into the "Proposal Sent" stage on your Kanban board, get in the habit of immediately creating a Google Task with a due date in seven days to follow up.
- Canned Responses for Consistency: Use Gmail’s canned responses (now called templates) to send standardized follow-up emails when a deal hits a certain stage. This ensures your messaging is always on point.
Optimizing processes like this is a huge focus for businesses right now. The global market for flowchart and diagramming tools hit $2 billion USD in 2023 and is on track to reach $3.5 billion by 2030. This growth is tied directly to sales efficiency, with 88% of sales leaders agreeing that a consistent, mapped-out process dramatically improves new rep training. It also helps cut down on the admin tasks that eat up to 30% of a salesperson's time.
With your flowchart designed, the next logical step is to translate it into functional processes. To get a better handle on this, learning how to create effective workflows is a great next step. By pairing clear rules with smart automation, your sales process flowchart will transform from a static document into a dynamic engine that actually drives sales.
Getting Your Sales Flowchart Off the Ground
Creating your sales process flowchart is a huge first step, but the real work starts now. A beautiful diagram is useless if it's just gathering digital dust in a shared drive. The true test is how well you roll it out to your team and commit to making it better over time.
This next phase is all about turning that visual map into a living, breathing part of your team's daily hustle. The goal isn't to hand down a rigid set of rules from on high. It's about giving your team a tool that genuinely makes their lives easier and helps them close more deals.
Launching the New Process with Your Team
A successful rollout isn't a memo; it's a conversation followed by solid training. You have to get your team to buy into the "why" before you ever get to the "how."
Set aside some real time to walk them through the new process. Don't just show them the chart—explain how it solves the specific headaches they deal with every day. Frame it as the answer to common frustrations like leads falling through the cracks, inconsistent follow-ups, or not knowing where a deal really stands. When they see it as a tool built for their success, adoption happens naturally.
In that initial session, make sure you cover:
- A full walkthrough of the flowchart, stage by stage. Explain what it takes for a deal to enter and exit each phase.
- A hands-on demo within your Google Workspace tools. Show them exactly how to drag a deal across the Kanban board or update the tracking sheet. No ambiguity.
- The location of the "living" document. Make sure everyone knows where to find the flowchart and can access the latest version instantly.
Gathering Feedback and Driving Adoption
The flowchart you launch with will almost certainly not be the final version. That's a good thing. The initial rollout is the perfect chance to get feedback from the people who are actually using it. Your reps will immediately spot any clunky steps or criteria that just don't make sense in the real world.
Encourage honest feedback right from the start. Set up a dedicated Slack channel or schedule quick 15-minute check-ins each week for the first month. This approach makes your team feel heard and gives them a sense of ownership over the process.
The only true measure of a good sales process is its adoption rate. If your team isn't using the flowchart, it doesn't matter how perfectly designed it is. Make it simple, make it valuable, and let them help you shape it.
It's no surprise that companies with a formally documented sales process are 33% more likely to be high-growth. That growth doesn't come from the document itself, but from the consistent, focused action it enables.
Turning Your Flowchart into a Dynamic Tool
Once your team is consistently using the new system, your flowchart evolves from a static diagram into a powerful diagnostic tool. Now, you can start using the data you're collecting to find bottlenecks and fine-tune your entire sales engine.
This is where the real fun begins. By analyzing how deals move through your pipeline, you can pinpoint exactly where things get stuck or slow down. This data-driven approach takes the guesswork out of improving your process, allowing you to make surgical changes that actually impact the bottom line.
Start tracking these key metrics right away:
- Conversion Rate Between Stages: What percentage of deals move from "Qualified" to "Demo"? From "Proposal Sent" to "Negotiation"? A big drop-off at any stage is a massive red flag telling you where to look first.
- Average Time in Each Stage: Are deals sitting in the "Negotiation" stage for an average of 30 days? That might signal an issue with your pricing, the clarity of your proposals, or how your team handles objections.
- Total Sales Cycle Length: Keep an eye on the total time it takes to get from that first touchpoint to a closed deal. As you fix the small leaks in each stage, this number should steadily decrease.
By reviewing this data regularly, you can start asking much smarter questions. For example, if conversions from "Demo" to "Proposal" are low, maybe the demo script needs work, or perhaps prospects aren't being qualified properly before the demo even happens.
To really kick things into high gear, you can look at how different technologies can help. For instance, a CRM with VoIP integration can automate call logging and data entry, which not only saves time but also ensures your tracking data is far more accurate.
Ultimately, your sales process flowchart should never be "finished." Think of it as a dynamic framework for continuous improvement—a tool that helps you learn, adapt, and build a more efficient and predictable revenue machine.
Answering Your Team's Top Questions About Sales Process Flowcharts
Even the most intuitive flowchart will spark a few questions. That’s a good thing—it means your team is thinking about how to apply it to their day-to-day work.
Let's walk through some of the most common questions that pop up when a team first gets their hands on a new visual sales workflow. Nailing these down early on prevents confusion and helps everyone get on board fast.
How Often Should I Update My Sales Process Flowchart?
Think of your flowchart as a living document, not something you carve in stone. A quarterly review is a great rhythm to get into. That’s enough time to collect real data and spot trends without letting your process go stale.
But don’t just wait for the calendar invite. You need to be ready to adapt on the fly. You should jump back into the flowchart immediately if you:
- Launch a new product or service that shifts your pitch.
- Break into a new market with a totally different kind of buyer.
- Keep seeing deals get stuck in the exact same spot.
This is where your sales tools become your secret weapon. If your conversion rates suddenly tank at one particular stage, that's a blinking red light telling you to dig in and see what’s broken. Don’t forget to listen to your reps, either—they’re on the front lines and know what’s really happening in conversations.
What Is the Biggest Mistake to Avoid When Creating a Flowchart?
The single biggest trap is overcomplicating it. It’s so tempting to map out every single "what if" scenario, every possible objection, and every little exception. Before you know it, you’ve got a confusing mess that looks like a plate of spaghetti, and your team will just ignore it.
The real goal here is to build a clean, reliable path for the 80-90% of deals that follow a predictable journey. Start with just five to seven core stages—the essential milestones from lead to closed-won. You can always build out separate mini-flows for unique situations later. Simplicity is what gets people to actually use it.
Can a Sales Flowchart Work for a Freelancer or Solo Business?
Absolutely. In fact, it might be even more crucial when you’re flying solo. When you’re the entire sales department, marketing team, and CEO all rolled into one, a structured process is the only thing keeping you sane.
A simple flowchart gives you the discipline to focus your time where it counts most. It makes sure good leads don't get buried in your inbox when you're swamped with client work, and it lets you forecast your income with a whole lot more confidence. A basic Kanban board in your Gmail that mirrors your flowchart stages can be a total game-changer, turning that chaotic inbox into your client-winning command center.
How Do I Get My Team to Actually Use the New Flowchart?
Getting your team to adopt the new process comes down to two things: involvement and value.
First, bring them into the creation process. Don't just hand down a finished diagram from on high. When your reps help build the flowchart, they have a sense of ownership. They understand the "why" behind each step, and they'll be way more invested in making it work.
Second, it has to make their lives easier, not add another layer of busywork. This is why plugging the flowchart directly into the tools they already use, like Google Workspace, is so powerful. If the process lives inside their inbox and helps them see what to do next, track their deals, and close them faster, they'll get it instantly. Frame it as a tool to help them win, not as another way for you to micromanage them. A perfect process is useless if nobody follows it.
Ready to turn your flowchart from a static image into a dynamic workflow? Tooling Studio offers lightweight extensions that bring powerful project and sales management right into your Google Workspace. Transform your Gmail into a collaborative Kanban board and start managing your sales pipeline with the visual clarity your team needs. Get started with Tooling Studio today.
 Download our Plugin