
How to Measure Team Productivity: Real Strategies That Work
Master how to measure team productivity with proven methods that drive results. Discover metrics and strategies top managers use daily.

What Actually Drives Team Performance (Hint: It's Not Hours Logged)
When we start thinking about how to measure team productivity, our minds often jump to the easiest metric: time. How many hours did someone log? How many items did they check off a to-do list? It feels solid and simple to track, but it's a common trap.
Focusing purely on hours worked is like judging a chef by how long they spent in the kitchen instead of by how the food tastes. You might see a lot of frantic activity, but that’s no guarantee of a delicious meal.
The Productivity Paradox: Busy vs. Valuable
This brings us to the productivity paradox: a situation where a team looks incredibly busy, yet creates very little actual value. Calendars are slammed, chat channels are constantly pinging, and tasks are always moving, but the needle on business goals barely budges.
I once worked with a marketing team that was proud of launching ten campaigns a month. The activity level was impressive, but a closer look revealed that only two of those campaigns were generating any real leads. The other eight were what I'd call 'elaborate procrastination'—complex tasks that looked like work but had zero impact.
This isn’t an isolated story; it’s a common problem. The pressure to appear busy creates a culture of "work about work." In fact, recent data shows employees now spend around 60% of their time on things that don’t move the business forward, like switching between apps or hunting for information. Discover more insights into workplace productivity statistics. This administrative drag is a quiet drain on real progress.
From Activity Metrics to Impact Metrics
The most effective leaders I've worked with have all made one crucial change: they measure impact, not activity. Instead of asking, "How many support tickets did you close?" they ask, "What was our first-contact resolution rate?" or "Did our customer satisfaction score go up this quarter?" The first question tracks busyness, while the others measure quality and customer value.
To make this shift, your team has to redefine what "done" truly means. It’s not just about finishing a task; it’s about achieving a specific, valuable outcome. Here’s how you can spot the difference:
- Busyness: The team holds daily meetings that are just a round-robin of status updates.
- Impact: Meetings end with clear decisions and actionable next steps that push a project forward.
- Busyness: A developer pushes ten small, insignificant code updates.
- Impact: A developer ships one feature that reduces user friction by 20%.
Much of this unproductive busyness comes from a cluttered digital environment. When your team is constantly toggling between different tools, they lose the focus needed for high-impact work. For some practical tips on cleaning this up, check out our guide on how to create a productive workspace. The ultimate goal is to draw a straight line from daily tasks to tangible business results.
Building Your Measurement System From the Ground Up
To truly understand team productivity, you need to move past just counting activities. The idea isn't to just throw numbers onto a dashboard; it's about building a system that actually shows your team's impact and helps everyone get better. I like to think of it less as a grading system and more as a GPS for our projects—it tells us where we are and helps us chart a course to where we want to be.
When done wrong, measurement creates stress and people start gaming the system. But when done right, it builds genuine confidence and sharpens focus.
Start With a Baseline, Not a Bullseye
A common pitfall is setting huge, ambitious targets right out of the gate, which can be incredibly disheartening for the team. Before you can aim for improvement, you have to know your starting line. Establishing a baseline is the essential first step. For a couple of weeks, just watch and gather data without passing judgment.
How long does a card usually sit in the "In Progress" lane? On average, how many support tickets does the team close each week? Using a visual tool like Tooling Studio's Kanban Tasks right inside your team's Gmail can make this almost automatic, showing you the natural rhythm of your workflow. This early phase isn’t about performance; it’s about understanding your current reality. That's the only way to set goals that are both challenging and achievable.
Balance the What With the How
Raw numbers can be deceiving. A team might be shipping features faster than ever (the "what"), but if the code quality is poor and team members are burning out (the "how"), you're really just speeding toward a major problem. A solid measurement system looks at both sides of the coin.
- Quantitative (The What): These are the concrete figures you can count. This includes things like task completion rates, the time it takes to finish a task (cycle time), or staying on budget.
- Qualitative (The How): This is all about the human element. Think team morale, how well people are collaborating, and the feedback you get in one-on-ones or team meetings.
I once saw a team whose velocity metrics were off the charts. On paper, they looked amazing. But then the manager found out during a casual chat that to hit those numbers, everyone was skipping code reviews. The quantitative data painted a rosy picture, but the qualitative feedback uncovered a huge quality issue waiting to explode.
This is why the best systems are always created with your team, not forced on them. The trick is to frame it as a shared mission. Try asking, "What's the best way for us to see our progress as we work on this new feature?" This makes measurement a tool for everyone, building a sense of ownership instead of a feeling of being watched.
To help you decide which metrics to focus on, here's a quick comparison of some essential productivity measures.
Essential Productivity Metrics Comparison
A comprehensive comparison of different productivity metrics, their benefits, challenges, and best use cases for various team types
| Metric Type | Best For | Implementation Difficulty | Data Required | Key Benefits |
|---|---|---|---|---|
| Cycle Time | Agile/Dev teams, Support desks | Medium | Task start/end timestamps from a Kanban or project board | Identifies bottlenecks and shows the true speed of delivery from start to finish. |
| Throughput | Any team with a consistent flow of tasks | Low | Count of completed tasks per time period (e.g., week, sprint) | A simple measure of output; easy to track and understand trends. |
| Team Sentiment/Morale | All teams, especially remote or high-pressure ones | Medium | Regular, simple surveys (e.g., weekly pulse checks) or 1-on-1 feedback | Provides crucial context for quantitative data; early warning for burnout. |
| Work-in-Progress (WIP) | Kanban-based teams, teams prone to multitasking | Low | Real-time count of tasks in 'In Progress' status on a board | Helps improve focus, reduces context switching, and speeds up flow. |
| Customer Satisfaction (CSAT) | Customer-facing teams (support, success, product) | High | Customer surveys, feedback forms, reviews | Directly connects team output to business value and customer happiness. |
Ultimately, the best approach is to pick a balanced mix of metrics. Relying on just one number, like throughput, can be misleading. Combining a quantitative metric like cycle time with a qualitative one like team sentiment gives you a much richer, more accurate picture of how your team is truly doing.
Matching Metrics to Your Team's Actual Work
Even the most detailed measurement plan is useless if the metrics don't connect to how your team actually creates value. This is where so many leaders get it wrong—they track what’s easy to count, not what’s important. A metric that fires up a sales team could easily crush a creative team’s innovation. Learning how to measure team productivity effectively means customizing your yardstick, because different types of work require different ways of measuring success.
This isn’t just a small problem; it’s a major challenge for businesses. Leaders are well aware of the issue. A Deloitte survey found that 74% of business leaders believe finding better ways to measure performance is critical. Yet, a shockingly low 17% feel their organization is actually effective at it. This shows a massive disconnect where good intentions often lead to counterproductive results.
For Creative and Product Teams
Imagine a graphic design team measured only by the number of mockups they produce each week. You’d get a flood of rushed, low-quality designs just so they could hit a target. The team might look "productive" on a spreadsheet, but they’re creating more work down the line with endless revisions and unhappy stakeholders. This is a perfect example of measuring activity over impact.
Instead, a smarter approach focuses on the quality and usefulness of the work. Think about these alternatives:
- Revision Rounds: Track how many rounds of feedback a design needs before it gets the green light. A lower number often means a clearer initial brief and a higher-quality first draft, which saves everyone time and frustration.
- Client Adoption Rate: For a product team, what percentage of users actually engage with a new feature after it launches? This metric directly measures whether the work delivered real, tangible value to your users.
- Qualitative Feedback Scores: Numbers alone don't tell the whole story. By regularly asking internal clients for feedback on a 1-5 scale, you can gather crucial context that quantitative data might miss.
This simple adjustment shifts the conversation from, "How much did you do?" to, "How effective was what you did?" It puts the value on deep thinking instead of frantic activity.
For Sales and Support Teams
Sales and customer support teams often get stuck with misleading metrics, too. A sales manager who only tracks the number of calls made per day is encouraging reps to dial and hang up, not to build meaningful relationships. A support manager who focuses on tickets closed per hour incentivizes agents to resolve cases quickly, even if the customer’s problem isn’t truly solved—leading to frustrated repeat callers.
The goal is to measure the quality of interactions, not just the raw number of them. Here are better ways to gauge real productivity:
- First Contact Resolution (FCR): For support, what percentage of issues are completely solved in the first interaction? This is a powerful indicator of both team efficiency and customer satisfaction.
- Conversion Rate from Demo to Deal: This sales metric gets straight to the point. It focuses on how effective sales conversations are, rewarding quality engagement over a high volume of outreach.
- Customer Lifetime Value (CLV): You can think of this as the ultimate metric. It reveals whether your sales and support efforts are creating loyal, high-value customers who stick around for the long term.
By choosing metrics that reflect your team’s true purpose, you guide them toward success that actually means something.
Setting Up Tools That Actually Get Used
Let's be honest: the biggest challenge in measuring team productivity isn't finding the perfect metric. It's convincing your team to actually use the tool you picked. The wrong choice adds another login to remember and creates more administrative busywork, which is the exact opposite of what you’re trying to achieve.
The best systems don’t feel like another system at all. They weave measurement directly into the daily workflow your team already knows and trusts, making it an invisible and effortless part of how they get things done.
Leverage What Your Team Already Uses
Your team probably spends most of its day inside platforms like Google Workspace, bouncing between Gmail, Docs, and Calendar. So why force them into a completely different project management app just to track their progress? Every time a team member has to switch tabs and log into another platform, they lose focus and momentum.
Instead of pulling people out of their flow, bring the tools to them. This approach reduces the friction of adoption to almost zero. For example, a native extension like Tooling Studio’s Kanban Tasks embeds a shared task board directly inside Gmail. An email can become an actionable task with a simple drag-and-drop. When tracking is a natural part of the existing process, you don't have to fight for buy-in.
Automate Data Collection Without Annoying Your Team
No one wants to spend 30 minutes at the end of the day trying to remember everything they did just to fill out a status report. The most effective productivity measurement happens as a byproduct of work, not as an extra chore. Smart automation is what makes this possible.
When a task card moves from "In Progress" to "Done," that action should automatically update your throughput and cycle time metrics. There's no need for manual entry. For development teams using platforms like Jira, you can dig even deeper. For instance, you can automatically measure how long tasks spend in each phase of the workflow, which can reveal hidden bottlenecks without anyone having to start a stopwatch. This resource on Jira time in status tracking offers some great ideas on how to set this up.
Remember, the goal is to track the work, not the worker. This approach respects your team's time and focus. It also ensures the data you collect is a genuine reflection of progress, not just a record of who remembered to update their tickets.
To help you find the right fit for your team, here's a side-by-side look at how some popular tools approach productivity tracking, with a focus on their features and integrations.
Productivity Tools Feature Comparison
Side-by-side comparison of popular productivity measurement tools, their key features, integration capabilities, and pricing
| Tool Name | Key Features | Integration Options | Team Size | Monthly Cost |
|---|---|---|---|---|
| Tooling Studio Kanban Tasks | Deep Google Workspace integration, converts emails to tasks, shared Kanban boards within Gmail. | Native to Google Tasks, Gmail, Google Calendar. | Individuals to Large Teams | Free plan available; Pro starts at ~$6/user. |
| Jira | Advanced custom workflows, powerful reporting and analytics, sprint planning, bug tracking. | Extensive marketplace; Slack, GitHub, Jenkins, etc. | Small Teams to Enterprise | Free for up to 10 users; Standard starts at ~$8.15/user. |
| Asana | Multiple project views (Board, List, Timeline), task dependencies, automation rules. | Slack, Google Drive, Microsoft Teams, Adobe CC. | Individuals to Enterprise | Free plan available; Starter plan starts at ~$10.99/user. |
| Trello | Simple, visual Kanban boards, Butler for no-code automation, "Power-Ups" for extensibility. | Slack, Google Drive, Dropbox, Evernote. | Individuals to Large Teams | Free plan available; Standard plan starts at ~$5/user. |
As the table shows, the best tool often depends on your team's primary work environment. If your team lives in Google Workspace, a deeply integrated solution like Kanban Tasks is a natural fit. For complex software projects with specific workflow needs, Jira often provides the necessary power and customization.
Build Dashboards People Actually Check
A dashboard packed with dozens of confusing charts is just digital noise. To be useful, it needs to be designed for the team, not just for management. It should answer one simple question at a glance: "Are we on the right track?"
Here’s how to build a dashboard that your team will actually look at:
- Showcase the 2-3 metrics that matter most to your team's current goals. Is it cycle time? Throughput? Customer satisfaction? Focus on what helps them make decisions today, not every metric you can possibly track.
- Make it visible and accessible. Pin a daily snapshot in your team's main chat channel or display it on a dedicated monitor in the office. Constant, easy visibility keeps everyone aligned without needing to ask.
- Use it to start conversations, not to assign blame. A good dashboard is a tool for team huddles. It helps you spot roadblocks together and celebrate wins as a group. Think of it as a scoreboard for the team, not a report card for individuals.
Turning Numbers Into Action Plans That Work
Getting the data is the easy part. A dashboard packed with colorful charts can look really productive, but the numbers don't mean much until you use them to tell a story about your team's performance. The real work—and where good leadership comes in—is figuring out what the data is trying to say and then building an action plan that actually improves things. It's one thing to glance at your car's speedometer; it's another to know if you're even on the right road.
Spotting the Signal in the Noise
Your team's productivity numbers will go up and down. That’s perfectly normal. The trick is learning to tell the difference between a random dip and a real problem. For instance, a single week of low throughput might just be because of a long weekend or a few people on vacation. But if you see task cycle times creeping up steadily for two months straight, that’s not just noise. That’s a signal that a bottleneck is forming, and you need to investigate. It’s all about looking for trends, not getting distracted by isolated data points.
This ability to react to performance data is key for any growing team. Look at the bigger picture: the U.S. Bureau of Labor Statistics reported that after a period of slowdown, productivity jumped in 78 out of 86 manufacturing industries in 2021. That didn't happen by accident. It happened because organizations dug into their data, figured out what wasn't working, and made smart changes to their processes and technology. It’s a powerful reminder to measure, understand, and then act.
From Insights to Improvements
Once you’ve spotted a meaningful pattern, you need to turn that "aha!" moment into a real-world fix. Instead of just pointing out problems, come to the table with ideas for solving them together.
- Bottleneck Identified: Is your Kanban board's "Review" column constantly overflowing? That’s a huge red flag that your review process is holding everyone back. It's the perfect opportunity to sit down with the team and map out a better workflow.
- Resource Misallocation: Maybe your data shows the support team is swamped with tickets while the development team is waiting for feedback. This insight gives you the justification you need to temporarily shift a person over to help or to pause a less critical project to free up resources.
Fixing these issues often comes down to improving the tools and habits your team uses every day. By focusing on mastering efficient task management in Google Workspace, for example, you can smooth out the clumsy handoffs that create delays. For any team working with multiple online tools, this kind of workflow tuning is a core part of good SaaS Operations Management.
Finally, how you share your findings is just as important as what you find. When you bring the data to your team or stakeholders, treat it as the start of a conversation, not a final grade. Instead of saying, “We’re falling behind,” try something like, “I’ve noticed our project timelines are getting longer. Let’s brainstorm some ways we can get back on track.” This approach builds a culture of continuous improvement and shared responsibility, making data a tool for growth instead of a source of stress.
Making Measurement Part of Your Team Culture
You can have the best action plan in the world, but if your team sees measurement as a threat, it’s dead on arrival. The real key to making productivity tracking work is to weave it directly into your team’s culture. This isn't about watching over everyone's shoulder or creating a pressure cooker environment. It's about giving your team the information they need to succeed together.
When you get this right, tracking metrics stops feeling like a mandate from above and starts feeling like a shared goal.
Building Trust Through Transparency
Transparency is a powerful tool, but I've seen it go wrong. Some managers roll out public leaderboards showing individual task completions, thinking it will spark some friendly competition. In reality, it often just creates anxiety and encourages people to game the system by picking easy tasks to inflate their numbers.
A much better way is to frame metrics as a team scoreboard, not an individual report card. Instead of highlighting who closes the most tickets, you could track the team’s overall first-contact resolution rate. When that number improves, you celebrate it together in your team meeting. The conversation immediately shifts from "Who's the best?" to "How are we improving?"
The easiest way to prevent pushback is to get your team involved from the very beginning. Ask them directly: "What's the biggest bottleneck slowing us down right now? How can we measure it to see if our ideas are actually working?" When team members help choose the metrics, they feel ownership. They get the why behind the numbers, turning a scary process into a collaborative one.
Using Data to Support, Not Replace, Judgment
Your data should be the start of a conversation, not the end of it. A dip in someone’s output isn't automatically a performance problem; it’s a signal to check in. As a leader, your role is to bring the human context that a dashboard simply can’t provide.
I once had a developer whose commit frequency suddenly dropped off a cliff. The data just said "less activity." Instead of jumping to conclusions, I set up a quick, informal chat. It turned out he was stuck on a particularly nasty piece of code and was feeling too intimidated to ask for help. The data didn't fix the issue, but it showed me exactly where I needed to step in with support and guidance.
Once you have the numbers, learning how to turn data into actionable insights is an essential leadership skill. It’s all about using metrics to ask smarter questions.
Celebrate the Journey, Not Just the Destination
Finally, don’t hold all your praise for the final project delivery. Small wins are just as important for building momentum and morale. Did the team manage to cut the average cycle time for a specific task by 10%? That’s fantastic—celebrate it! Did someone’s simple suggestion finally fix a recurring blocker? Acknowledge it publicly.
These small celebrations reinforce that the goal of measurement is continuous, meaningful improvement. It shows your team that their day-to-day efforts to make things better are noticed and valued. This builds a powerful, positive feedback loop where data fuels growth, and that growth boosts morale, creating a culture where everyone is focused on long-term success.
Your Implementation Roadmap
Putting a new measurement system in place can feel like a massive undertaking, but it doesn't have to throw your team's workflow into chaos. The secret is to treat it as a gradual rollout, not a big, disruptive event. This approach breaks the process down into manageable phases: collecting metrics, spotting trends, and making meaningful improvements.
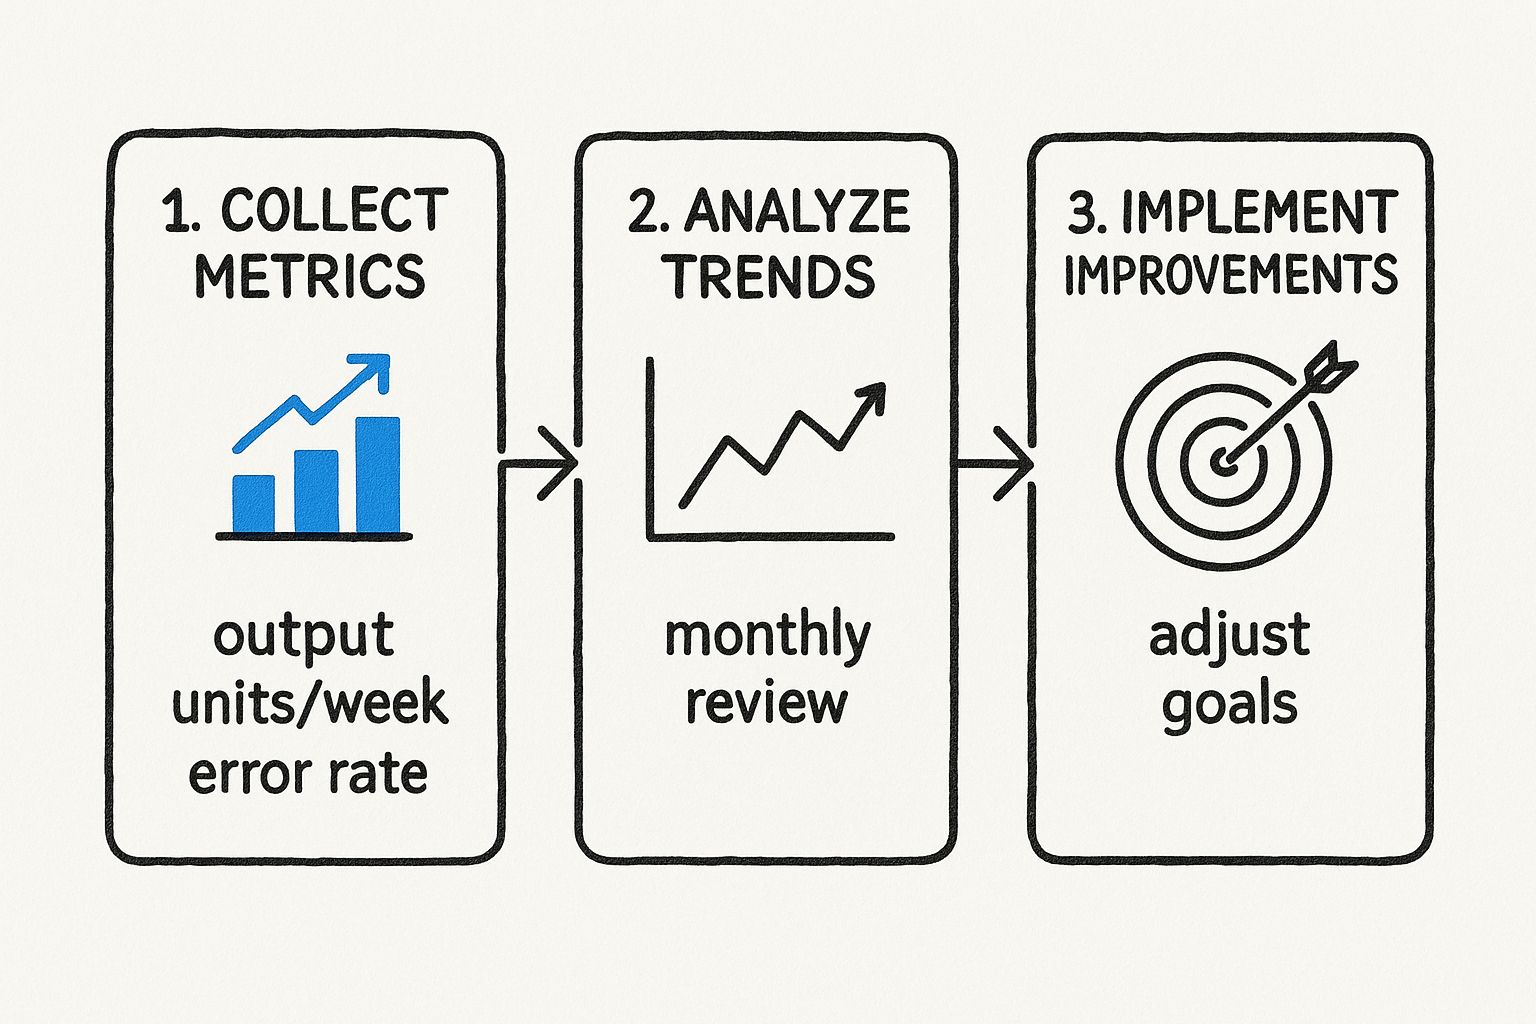
This visual shows an important point: measuring team productivity is a continuous loop of improvement, not a one-time setup.
Start with a Pilot Program
Instead of overwhelming everyone with a company-wide launch, try testing your new framework with a single team that's open to the idea. This gives you a safe space to iron out any wrinkles before going big. Pick a team that embraces change and has work that’s relatively easy to measure.
The goal isn't to get it perfect on the first try—it's to learn what works for your people. A realistic timeline for a pilot program with a team of 5-8 people is about 4-6 weeks. This gives you enough time to gather some initial data, collect feedback, and tweak your approach. Make sure to document everything: what went well, what flopped, and any surprising insights you gained.
Build a Clear Communication Plan
This is the make-or-break moment for any new process. Your team has to understand the "why" behind the shift, or they'll never get on board. Before you even think about rolling it out, get your communication strategy in order.
Your kickoff meeting should clearly address:
- The "Why": Explain how these new metrics connect to the team's and the company's goals. Frame it as a tool to help everyone succeed and remove roadblocks, not as a new way to micromanage.
- The "What": Be very clear about the 2-3 key metrics you’ll start tracking. Define what they are, and just as importantly, what they are not.
- The "How": Walk them through how the data is collected (ideally, it should be automatic) and show them where they can see it for themselves. Reassure them that this information is for spotting bottlenecks and celebrating wins together.
This is also the perfect time to introduce any tools that will support the process. For teams already using Google's tools, a smooth integration is essential. For some great ideas on this, check out our guide on Google Workspace project management.
Scale and Maintain Momentum
Once you've run a successful pilot and refined your process, you're ready to start scaling to other teams. Take what you learned from the pilot and create a simple playbook with templates and talking points to make each new rollout smoother than the last.
But the work isn’t done after launch. To keep the momentum going, schedule regular monthly or quarterly check-ins to review the metrics as a team. Use this time to celebrate improvements—no matter how small—and collaboratively decide which bottleneck to tackle next. This keeps the measurement process from feeling stale and ensures it becomes a positive part of your team's culture.
Ready to stop guessing and start measuring what truly matters? Tooling Studio’s Kanban Tasks integrates directly into your team’s Gmail, making productivity tracking an effortless part of your workflow. Get started for free today and see the difference.
 Download our Plugin