
Excel Kanban Board: A Complete How-To Guide (2026)
Learn to build a dynamic Excel Kanban board from scratch including templates, formulas, automation, plus when to upgrade to a dedicated tool.
If your team is tracking work in a spreadsheet, status updates usually live in three places at once. The sheet says one thing, email says another, and someone’s memory fills in the rest. That’s when an excel kanban board starts to look less like a nice-to-have and more like a rescue plan.
I’ve seen Excel work surprisingly well for this. I’ve also seen teams push it far past its comfort zone. The sweet spot is clear: Excel is a strong starting point for visual workflow management when you need something fast, familiar, and customizable. It becomes a weak long-term system when collaboration, automation, and integrations start to matter more than layout control.
This guide treats Excel the way experienced project managers should. Use it well. Build it cleanly. Add enough structure that it helps rather than confuses. Then know when to stop forcing a spreadsheet to behave like a real shared work system.
Why Your Spreadsheet Needs a Kanban Makeover
A plain task tracker fails in a predictable way. You start with a useful list of tasks, owners, and due dates. A few weeks later, the spreadsheet turns into a dumping ground. Rows pile up, priorities blur together, and every meeting starts with the same question: what’s in progress right now?
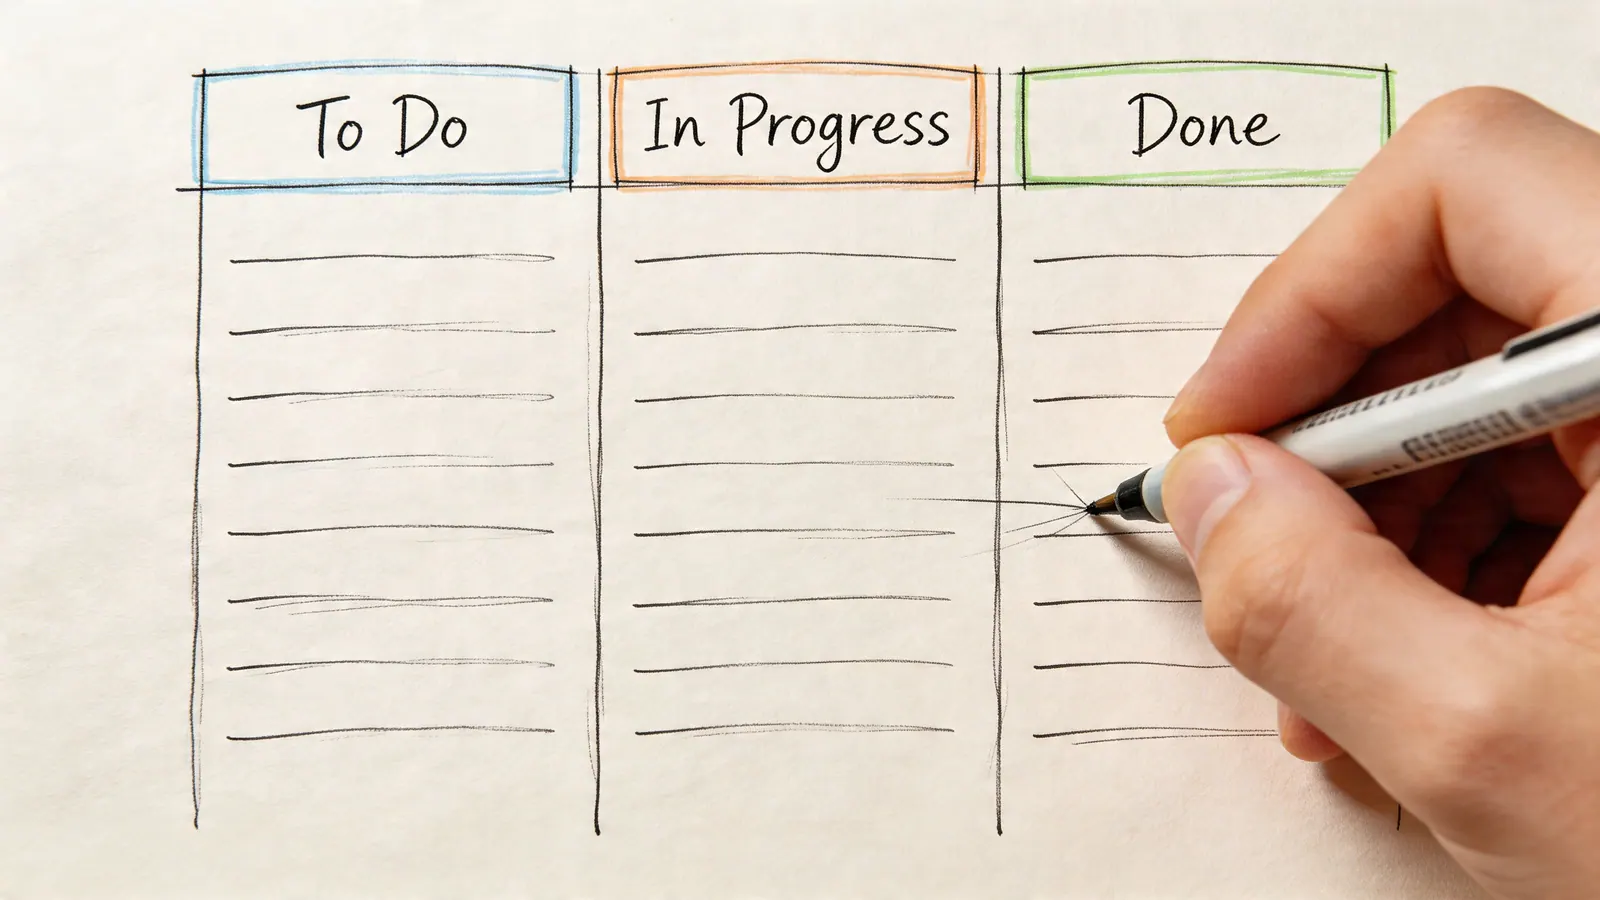
That’s the problem Kanban solves. Instead of hiding work in rows, it visualizes workflow. You stop managing a list and start managing flow. Tasks sit in visible stages such as Backlog, In Progress, and Done. Bottlenecks become obvious because everyone can see where work is stacking up.
Why Kanban still works so well
Kanban didn’t come from software. It came from operations discipline. The system originated at Toyota in the 1940s, where Taiichi Ohno used visual workflow management to improve production flow. The same principles still drive modern boards: visualize stages, limit work-in-progress, and separate categories with swimlanes, as described in this overview of the Toyota roots of Kanban in spreadsheet workflows.
That matters because an excel kanban board isn’t a gimmick. It’s a practical adaptation of a proven system into a tool many teams already have.
Practical rule: If your tracker helps you record work but doesn't help you see stalled work, it isn't managing flow.
Excel is often the first place teams try this because it lowers the barrier to entry. There’s no rollout, no procurement cycle, and no training overhead for basic use. For teams comparing spreadsheet workflows with broader work management approaches, this roundup on how to elevate team productivity with monday.com is also useful context because it shows what teams usually start wanting once their basic board is in place.
What an excel kanban board actually changes
A good board changes team behavior in simple ways:
- Work becomes visible so hidden queues stop hiding.
- Priorities become harder to fake because every task sits somewhere concrete.
- Meetings get shorter because the board answers the first layer of status questions.
- Ownership gets clearer when a card has a real assignee and due date.
The key is not decoration. A few colored cells won't fix a broken process. The true upgrade is moving from passive storage to active workflow. That’s where Excel can help a lot, at least for a while.
Laying the Foundation for Your Excel Kanban Board
Most excel kanban board failures start with the wrong instinct. People jump straight to formatting the board tab, merging cells, adding colors, and trying to make it look polished before the data structure is stable. That creates a board that looks good in screenshots and breaks the first time someone edits it.
Build the engine first. Then build the board.
Start with two sheets, not one
Use two worksheets from the beginning:
- Database
- Kanban Board
The Database sheet is the source of truth. Every task lives there as a structured row. The Kanban Board sheet is only for display. Keeping those roles separate saves you from constant cleanup later.
In the Database sheet, create columns for:
- Task ID
- Task Name
- Description
- Status
- Priority
- Assignee
- Start Date
- Due Date
- Finish Date
- Notes
Keep it boring. Boring is good here. Structured rows outperform pretty layouts every time.
Build the Database like a system, not a note pad
Excel is used by over 1.2 billion people worldwide, and advanced templates make that scale useful by relying on structured logic such as unique column IDs and formulas like VLOOKUP paired with COUNTIF to place task cards dynamically, as shown in this walkthrough of dynamic Excel Kanban setup techniques.
Even if you’re not using those formulas yet, set up the Database as if you will.
Use these habits from day one:
- Give every task a unique ID so you can reference tasks even if names change.
- Use one row per task and avoid stacked notes inside a single cell.
- Standardize status values so later formulas don’t break on variations like “In progress” versus “In Progress”.
- Format the data as a table in Excel so ranges expand cleanly when you add new tasks.
If your initial task list is trapped in files you received from clients or vendors, it can help to convert PDF to Excel before loading tasks into the Database sheet. That avoids a lot of manual retyping when you're starting from exported briefs, service requests, or scanned action lists.
Create a clean board layout
Once the Database exists, build the board tab. Use the classic, commonly understood flow:
| Column | Purpose |
|---|---|
| Backlog | Work not started or not yet prioritized |
| To Do | Ready for execution |
| In Progress | Actively being worked |
| Done | Completed work |
If your team needs a review step, insert Review between In Progress and Done. If your intake is noisy, keep a separate Incoming or Requested area before Backlog.
A practical board usually works better than an overcustomized one. Start with four or five columns. Add more only when a stage has a real decision attached to it.
Format for readability, not flair
Set the board up so people can scan it in seconds:
- Wider columns help cards read like cards instead of compressed rows.
- Wrapped text prevents task names from disappearing.
- Freeze top rows if you’ll add summary counters or filters above the board.
- Use consistent card fields such as Task ID, short title, assignee, and due date.
Avoid merged cells if you can. They make formulas and sorting harder than they need to be.
Keep the board tab presentation-focused. Keep the Database tab operational. Mixing those jobs in one sheet creates constant friction.
Decide your manual operating rules early
Before you automate anything, define how people will use the board. Most spreadsheet systems fail because the file has no usage discipline.
A simple rule set is enough:
- Only update status in one place. If the Database is authoritative, don’t let people type directly on the board.
- Close tasks properly. Require a Finish Date when a task moves to Done.
- Keep card text short. Long descriptions belong in Notes, not on the board face.
- Use one owner per task. Shared ownership sounds collaborative and usually produces drift.
For a broader look at where Excel works well and where it starts fighting the process, Tooling Studio has a useful piece on using Excel for project management.
The first version should feel plain
That’s a good sign.
The strongest first version of an excel kanban board is stable, understandable, and easy to maintain. It doesn’t need drag-and-drop behavior yet. It doesn’t need dashboard polish. It needs clean task records, clear stages, and enough consistency that formulas can build on top of it later.
Bringing Your Board to Life with Dynamic Features
A manual board works for a week. A dynamic one lasts much longer.
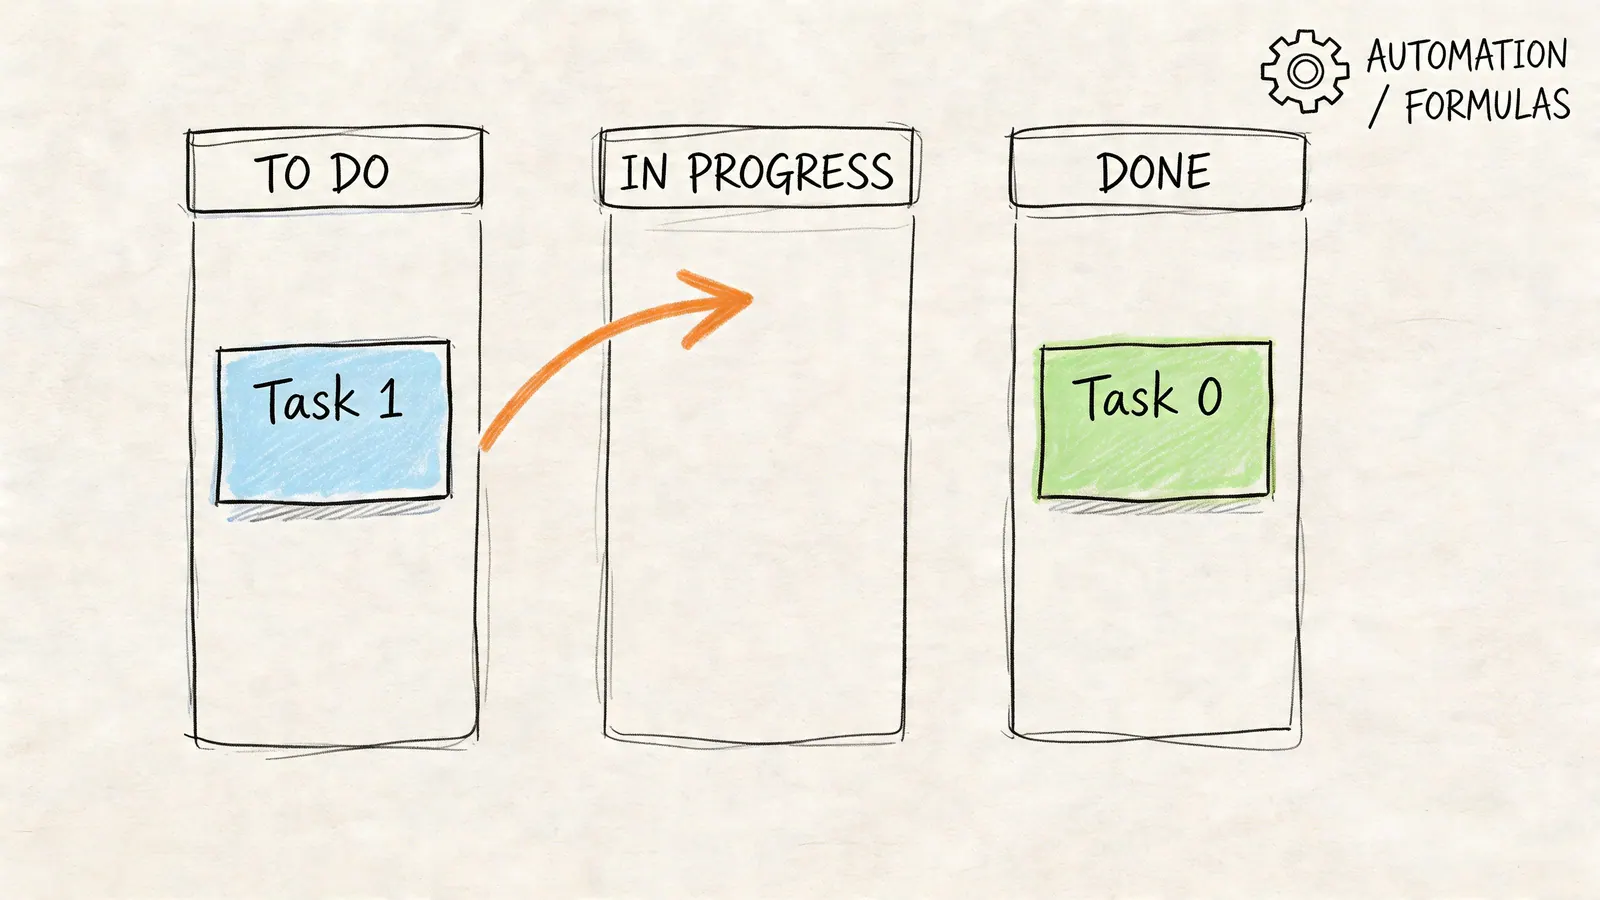
The difference is simple. In a manual setup, someone cuts, pastes, and reformats tasks whenever status changes. In a dynamic setup, the task lives once in the Database and appears on the board based on its status. That shift is what turns an excel kanban board from a visual tracker into a working system.
Add dropdowns before formulas
Start with data validation in the Database sheet. This is one of those unglamorous steps that saves hours later.
Create dropdowns for:
- Status such as Backlog, To Do, In Progress, Review, Done
- Priority such as High, Medium, Low
- Assignee from a maintained owner list
Formulas only work reliably when source values are consistent. If one person types “done” and another types “Done ” with a trailing space, your board logic starts producing ghosts.
Pull tasks onto the board automatically
There are two common ways to populate columns from the Database:
Use FILTER if you have Excel 365
If your Database sheet stores Status in column E, you can pull all To Do tasks into a board area with a FILTER formula. The exact formula depends on your layout, but the pattern is straightforward: return only rows where Status equals the target stage.
This is the cleanest option because it spills results automatically as your list changes.
Use INDEX and MATCH if you need compatibility
If your team works across mixed Excel versions, use INDEX and MATCH with helper logic instead. It’s clunkier, but it gives you more backward compatibility and more control over row-by-row display.
Some advanced spreadsheet builders also use VLOOKUP with COUNTIF and unique IDs to position cards in sequence. That method is especially useful if you want cards to appear in a specific order without using VBA.
The less you move cards manually, the more trustworthy your board becomes.
Use conditional formatting where it actually helps
Conditional formatting is where many Excel boards go off the rails. Everything gets color. Then nothing stands out.
Keep it purposeful. Use it for exceptions and meaning.
Good uses include:
- Overdue tasks in red when Due Date is before today and Status isn’t Done
- Priority colors so urgent work stands out
- Blank-hiding rules to keep card areas visually clean
- Completed tasks muted so active work remains the focus
Bad uses include rainbow boards with no clear legend, decorative gradients, and five shades that all mean roughly the same thing.
A useful card should answer four questions at a glance: what it is, who owns it, when it’s due, and whether it needs attention.
Put a WIP limit on active columns
Many teams using Excel skip the most important Kanban behavior. They visualize work, but they don’t limit work-in-progress.
That’s a mistake. WIP limits are what stop a board from becoming a prettier task pile.
According to this guide on setting WIP limits in Excel Kanban boards, implementing WIP limits with COUNTIF formulas and conditional formatting is a core Kanban practice, and WIP-limited Excel boards can reduce cycle time by 20-30% in small teams.
A practical implementation looks like this:
- Create a Settings sheet with WIP caps for active columns.
- Use COUNTIF to count visible tasks in each stage.
- Display an alert cell under the header if the count exceeds the limit.
- Apply conditional formatting to highlight overloaded columns.
For example, if In Progress should cap at five tasks, the helper formula can compare the current count to that limit and flag the column when it’s over.
Add movement cues, not fake drag-and-drop
Excel can imitate board movement, but it doesn't feel native. You can use macros for row movement on status change, but that adds fragility and sharing issues. Generally, it’s better to let the status dropdown drive movement automatically through formulas.
That gives you a board that behaves predictably without relying on VBA.
A simple visual pattern works well:
| Board behavior | Better Excel approach |
|---|---|
| Manual cut and paste | Change status in Database |
| Visual move between columns | Formula-driven placement |
| Hand-counting active work | COUNTIF summary |
| Manually spotting overdue tasks | Conditional formatting alert |
A short walkthrough helps if you want to see one approach in action:
Keep the dynamic layer maintainable
This is the line experienced project managers learn to respect. A little automation helps. Too much automation turns the sheet into something only one person understands.
Use formulas where they replace repetitive work. Don’t build a spreadsheet so clever that updating it requires an archaeologist.
Tracking Progress with Kanban Metrics and Dashboards
A board shows where work sits. A dashboard shows whether the system is improving.
That distinction matters. Teams often stop at visualization and assume they’re managing performance. They’re not. If your excel kanban board only displays tasks, it helps with coordination. If it also tracks cycle time, lead time, and throughput patterns, it starts helping you make better operating decisions.
Track the metrics that change decisions
You don’t need a huge dashboard. You need a useful one.
Start with a separate Metrics or Dashboard sheet and focus on a small set of fields pulled from your Database:
- Cycle Time using Start Date and Finish Date
- Lead Time using request date and completion date if you track intake
- Tasks completed by assignee
- Status distribution
- Tasks completed over time
The usual Excel approach is to calculate time-based metrics with DATEDIF and summarize patterns with PivotTables.
According to this guide on project tracking metrics in Excel Kanban systems, the most useful dashboard metrics are the ones tied to workflow decisions, not vanity reporting.
Where analytics help and where they go wrong
Excel remains effective. By implementing cycle time and lead time analytics with DATEDIF formulas and PivotTables, teams tracking these metrics in Excel Kanban boards have achieved throughput gains of 15-25%, according to this walkthrough of Kanban analytics in Excel.
The warning is just as important. The same source notes that incomplete data entry can flaw up to 60% of datasets and inflate metrics by over 35%.
That tracks with what happens in real teams. The formulas usually aren’t the biggest problem. Missing dates are.
If Finish Date is optional, your reporting isn't a reporting system. It's a guess with formatting.
Build a dashboard people will actually use
A workable layout usually includes three blocks.
Summary cards
At the top, show a few headline counts:
- Open tasks
- Tasks in progress
- Tasks completed
- Overdue tasks
Pivot view
Use a PivotTable to answer management questions quickly:
| Question | Excel feature |
|---|---|
| Who has the most active tasks | Pivot by Assignee and Status |
| Where is work getting stuck | Pivot by Status |
| What priority mix is in play | Pivot by Priority |
Trend chart
Add a simple line or column chart showing completed tasks over time. If your team works in weekly review cycles, this becomes far more useful than a raw task total.
Keep the dashboard honest
Three habits make Excel reporting more credible:
- Require date fields for work start and completion
- Refresh PivotTables deliberately before meetings
- Audit exceptions such as blank finish dates on completed tasks
The best Excel dashboard is still only as good as the data discipline behind it. If the team updates statuses casually or treats dates as optional, the dashboard becomes decoration. When the inputs are reliable, even a simple spreadsheet can expose flow problems early.
Excel vs Dedicated Tools A Reality Check
Excel deserves credit before it gets criticized. It’s flexible, familiar, and available in most organizations already. For a small team with a straightforward workflow, an excel kanban board can be a smart starting point.
The problem is that teams often mistake a workable starting point for a durable operating system.

Where Excel still wins
There are good reasons teams keep trying to make Excel work.
- It’s already in the stack. No extra tool approval is needed.
- People know how to use it. Even non-technical users can update rows and filters.
- It’s highly customizable. You can shape the workbook around your process instead of adapting to someone else’s defaults.
For solo operators, temporary projects, and low-complexity work, those advantages are real.
Where the cracks show up
The first crack is collaboration. Spreadsheet-based boards get messy as soon as several people need to update them at once. Version drift, overwritten edits, and uncertain ownership become everyday friction.
That isn’t just anecdotal. A 2025 Microsoft Workplace report noted that 62% of hybrid teams using Google Workspace or Microsoft 365 abandon Excel for Kanban due to collaboration friction, as summarized here in a discussion of Excel Kanban collaboration limits.
The second crack is fragility. As soon as your board relies on layered formulas, helper columns, hidden ranges, and conditional rules, maintenance becomes specialized work. One broken formula reference can subtly distort the board.
The third crack is workflow depth. Excel can display tasks. It does a much worse job handling comments, attachments, notifications, permissions, and team conversation around the work.
A spreadsheet can store workflow data. It doesn't naturally support workflow behavior.
Side-by-side trade-offs
| Capability | Excel Kanban board | Dedicated Kanban tool |
|---|---|---|
| Initial setup cost | Low if Excel is already available | Usually requires a new tool decision |
| Customization | Very high | Usually structured with guardrails |
| Real-time collaboration | Limited and often fragile | Designed for shared editing |
| Drag-and-drop workflow | Imitated, not natural | Native behavior |
| Comments and attachments | Awkward | Standard feature set |
| Notifications and automations | Manual or formula-heavy | Built in |
| Scalability | Degrades as complexity grows | Better suited to larger teams and boards |
This isn’t an argument that Excel is bad. It’s an argument that Excel has a ceiling.
The hidden cost of staying too long
Teams usually outgrow Excel in stages, not all at once.
First, someone becomes the “sheet owner.” Then updates lag because people don’t trust themselves to edit the formulas. Then side conversations move into email or chat because the sheet can’t hold context well. Finally, the board still exists, but primary project management happens around it.
If you’re evaluating what stronger-purpose tools look like once you hit that ceiling, this review of the best Kanban board software solutions for 2026 is a useful benchmark.
Excel remains a strong bootstrap option. It just shouldn’t be forced to carry a team long after the workflow has become collaborative, cross-functional, or fast-moving.
How to Migrate from Excel to an Integrated Kanban Tool
There’s a right time to stop improving the spreadsheet and move on. Organizations frequently miss it because the board still sort of works. But “sort of works” is expensive when it creates update lag, hidden work, and constant manual checking.
The migration decision usually becomes obvious when managing the system starts taking more effort than managing the work.
Signs you’ve outgrown the spreadsheet
You’ve likely hit the ceiling when these problems become routine:
- People stop updating the board consistently because editing it feels annoying or risky.
- Task context lives outside the board in Gmail threads, chats, and meeting notes.
- You need attachments, comments, and shared accountability on individual tasks.
- Status changes require cleanup because formulas, formatting, and helper ranges all depend on each other.
- The board works for one operator but struggles as a team workspace.
This is especially true for teams living in Google Workspace. A major weakness of spreadsheet setups is integration with external data, especially email. A 2026 Forrester report indicates that 71% of sales teams seek Gmail-native Kanban to cut CRM switching by 40%, a need described in this summary of Gmail-native Kanban demand and spreadsheet limits.
That’s the practical issue. Work often starts in email, not in a spreadsheet.
What a better migration target looks like
When choosing a replacement, don’t just look for “Kanban board” on a feature list. Look for a tool that fixes the exact pain that made Excel break down.
For Google Workspace teams, that usually means:
| Need | Why it matters after Excel |
|---|---|
| Native Gmail integration | Tasks often begin as emails and requests |
| Shared real-time board editing | Team updates shouldn't depend on file sync behavior |
| Drag-and-drop task movement | Status changes should feel natural |
| Task assignments inside the same workspace | Work shouldn't scatter across inboxes and sheets |
| A centralized view without app switching | Context should stay close to the work |

Migrate cleanly instead of rebuilding from scratch
The easiest migration is operational, not technical. Your goal is to move structured task data first, then refine the workflow inside the new tool.
Use this order:
Clean the Excel data
- Remove duplicate tasks
- Standardize status labels
- Ensure each task has one owner
- Fill in missing due dates where needed
Trim unused fields
- If Notes contain obsolete meeting leftovers, archive them elsewhere
- Keep only fields your team uses to make decisions
Map old statuses to new workflow stages
- For example, collapse “Doing” and “In Progress” into one stage if they mean the same thing
- Keep the new board simpler than the old workbook
Import active work first
- Don’t drag years of dead backlog into the new system on day one
- Migrate current work, near-term backlog, and high-value reference tasks
Run the new board in parallel briefly
- Use a short overlap period so the team can verify that nothing important was lost
- Then freeze the Excel file as an archive, not a living board
Move the process, not every spreadsheet habit. The whole point of migration is to stop carrying old friction forward.
Keep the transition disciplined
The biggest migration mistake is treating the new tool like Excel with a different skin. Teams recreate too many columns, too many statuses, and too much process debris.
A better approach is leaner:
- Keep stage names clear
- Keep ownership visible
- Keep task updates close to where work happens
- Let the tool handle movement and collaboration natively
When that happens, the board stops being something the team has to remember to update and starts becoming part of how they already work.
If your team has reached the point where the spreadsheet is more maintenance project than project tracker, it’s worth trying Tooling Studio. Its Kanban Tasks approach fits the operations of Google Workspace teams by keeping visual task management inside the environment where work already starts, especially Gmail, instead of forcing one more disconnected app into the stack.
 Download our Plugin